The D3.js visualization library can be used for creating beautiful graphs and visualizations using data from external sources including CSV files and JSON data.
To give you an example, this D3.js animation inside the Google Sheets associated with the COVID-19 tracker project visualizes the growth of Coronavirus cases in India over time. It uses the Google Visualization API, D3.js and the very-awesome Bar Chart Race component built by Mike Bostock, the creator of D3.js.
Google Sheets and D3.js
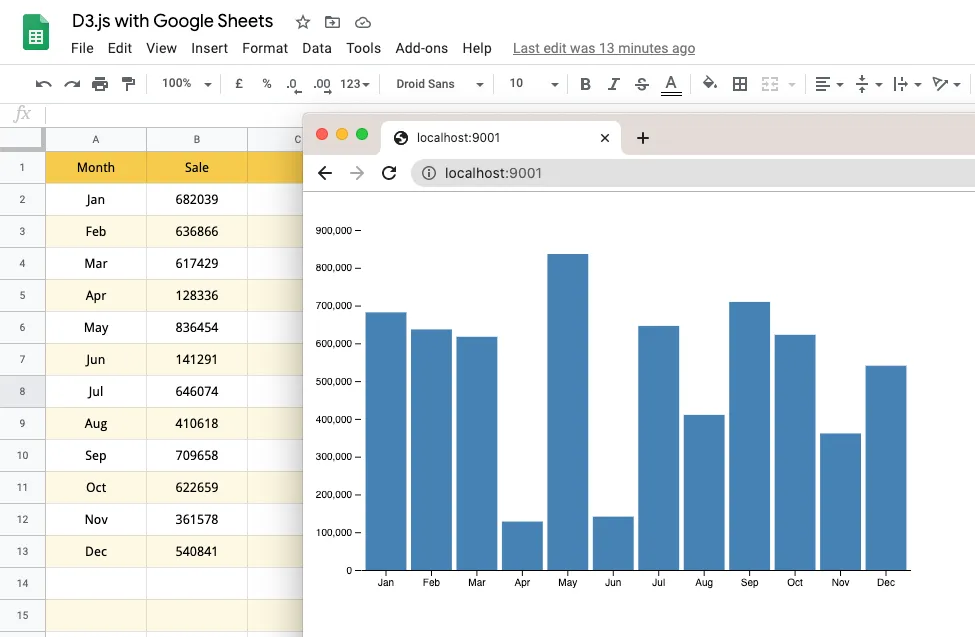
This guide explains how you can use data in your Google Spreadsheets to create charts with D3.js using the Visualization API. The data is fetched in real-time so if the data in your Google Sheets is updated, it is reflected in the graph as well.
Step 1: Make the Google Sheets public
Make your Google Spreadsheet public - you can either share the sheet with “anyone who has the link can view” access or make it public so even search engines that find your sheet that has the Charts data.
We are using this Google Sheet for this tutorial.
Step 2: Load the Libraries in HTML
Load the D3.js (v5) and the Google charts library in your index.html file. The JavaScript for rendering the D3 chart is written in the index.js file.
<!DOCTYPE html>
<html>
  <head>
    <script src="https://www.gstatic.com/charts/loader.js"></script>
    <script src="https://d3js.org/d3.v5.min.js"></script>
  </head>

  <body>
    <svg></svg>
  </body>
  <script src="./index.js"></script>
</html>
Step 3: Initialize the Google Visualization API
Here specify the URL of your publish Google Spreadsheet (the gid should point to the sheet that has the data). The Google Visualization API Query Language (reference) lets you use SQL like syntax to specify columns that should be used for fetching data from the Google sheet. You can also use offset, where and limit clauses to limit the data that is returned by Google Sheets.
google.charts.load('current');
google.charts.setOnLoadCallback(init);

function init() {
  var url = 'https://docs.google.com/spreadsheets/d/1YpiTo7Fc3QvBdbuReCIcwtg7lnmZupQAH57phrDLotI/edit#gid=0';
  var query = new google.visualization.Query(url);
  query.setQuery('select A, B');
  query.send(processSheetsData);
}
Step 4: Prepare the Data for D3.js
After the spreadsheet data is available, manipulate the response in an Array of Objects that can be read by d3.js. Google Sheets returns numerical data as String so we can either use parseInt or the Unary (+) operator to convert the String to Integer.
function processSheetsData(response) {
  var array = [];
  var data = response.getDataTable();
  var columns = data.getNumberOfColumns();
  var rows = data.getNumberOfRows();
  for (var r = 0; r < rows; r++) {
    var row = [];
    for (var c = 0; c < columns; c++) {
      row.push(data.getFormattedValue(r, c));
    }
    array.push({
      name: row[0],
      value: +row[1]
    });
  }
  renderData(array);
}
Step 5: Render the D3.js chart
Next, we create a Bar Chart in D3.js using the data from Google Sheets. You may follow this tutorial on @ObservableHQ to understand how to make bar charts inside D3.js. The chart is rendered in SVG.
function renderData(data) {
  const margin = { top: 30, right: 0, bottom: 30, left: 50 };
  const color = 'steelblue';
  const height = 400;
  const width = 600;
  const yAxis = (g) =>
    g
      .attr('transform', `translate(${margin.left},0)`)
      .call(d3.axisLeft(y).ticks(null, data.format))
      .call((g) => g.select('.domain').remove())
      .call((g) =>
        g
          .append('text')
          .attr('x', -margin.left)
          .attr('y', 10)
          .attr('fill', 'currentColor')
          .attr('text-anchor', 'start')
          .text(data.y)
      );

  const xAxis = (g) =>
    g.attr('transform', `translate(0,${height - margin.bottom})`).call(
      d3
        .axisBottom(x)
        .tickFormat((i) => data[i].name)
        .tickSizeOuter(0)
    );
  const y = d3
    .scaleLinear()
    .domain([0, d3.max(data, (d) => d.value)])
    .nice()
    .range([height - margin.bottom, margin.top]);

  const x = d3
    .scaleBand()
    .domain(d3.range(data.length))
    .range([margin.left, width - margin.right])
    .padding(0.1);

  const svg = d3.select('svg').attr('width', width).attr('height', height).attr('fill', color);

  svg
    .selectAll('rect')
    .data(data)
    .enter()
    .append('rect')
    .attr('x', (d, i) => x(i))
    .attr('y', (d) => y(d.value))
    .attr('height', (d) => y(0) - y(d.value))
    .attr('width', x.bandwidth());

  svg.append('g').call(xAxis);

  svg.append('g').call(yAxis);
}