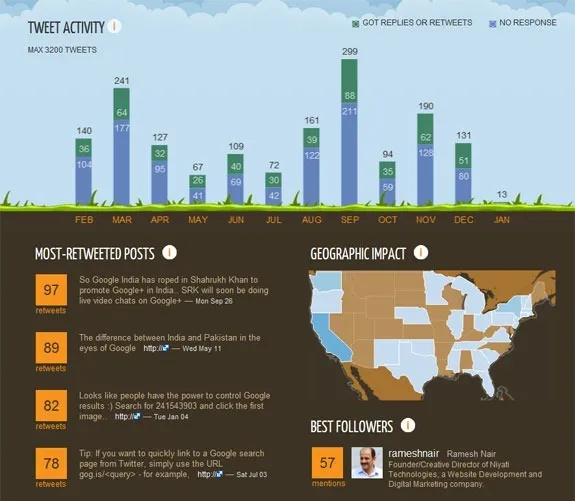
Create an Infographic with your Twitter Activity

twitter_infographics

If you have an account on Twitter, you should try Tweetsheet.

The app reads you Twitter activity and turns it into a visual infographic (see sample) revealing your top followers, your most-retweeted posts, and some other interesting details. The stats mentioned in the infographic are calculated using the last 3200 tweets that you have posted on Twitter.

One good thing about Tweetsheet is that only requires “read access” to your Twitter account during authentication so it won’t tweet your results without asking.

There’s however no option to save the infographic as an image. Thanks @Shankar.

Amit Agarwal

Amit Agarwal

Google Developer Expert, Google Cloud Champion

Amit Agarwal is a Google Developer Expert in Google Workspace and Google Apps Script. He holds an engineering degree in Computer Science (I.I.T.) and is the first professional blogger in India.

Amit has developed several popular Google add-ons including Mail Merge for Gmail and Document Studio. Read more on Lifehacker and YourStory

0

Awards & Titles

Digital Inspiration has won several awards since it's launch in 2004.

Google Developer Expert

Google Developer Expert

Google awarded us the Google Developer Expert award recogizing our work in Google Workspace.

ProductHunt Golden Kitty

ProductHunt Golden Kitty

Our Gmail tool won the Lifehack of the Year award at ProductHunt Golden Kitty Awards in 2017.

Microsoft MVP Alumni

Microsoft MVP Alumni

Microsoft awarded us the Most Valuable Professional (MVP) title for 5 years in a row.

Google Cloud Champion

Google Cloud Champion

Google awarded us the Champion Innovator title recognizing our technical skill and expertise.

Email Newsletter

Sign up for our email newsletter to stay up to date.

We will never send any spam emails. Promise.