The school has a Google Form where teacher enter the performance grades of their students. This form data is stored in a Google Spreadsheet and they are using Google Charts with the Google Visualization API to convert these tables of rows into visual charts that can be easily visualized.
The principal needs a public dashboard (in other words, a web page) where the charts can be displayed to external users without having to give them access to the Google Spreadsheet. This can be easily done with the HTML Service of Google Script and the Google Visualization API.
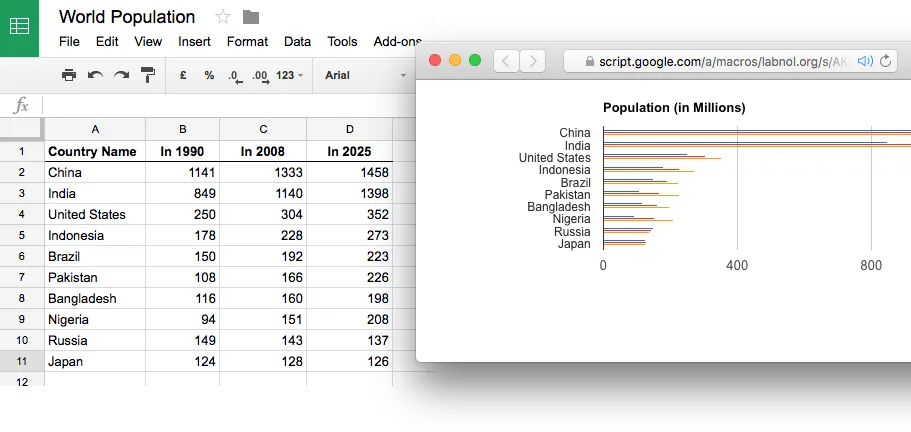
Here’s a simple example that fetches data from a Google Spreadsheet and display the corresponding chart on a web page using the HTML Service. The Google script needs to be published as a Web App and the access should be set to anyone (including anonymous) or you can also limit it to users of your own Google Apps Domain.
// Code.gs
function doGet(e) {
  return HtmlService.createTemplateFromFile('index')
    .evaluate()
    .setTitle('Google Spreadsheet Chart')
    .setSandboxMode(HtmlService.SandboxMode.IFRAME);
}

function getSpreadsheetData() {
  var ssID = 'PUT_YOUR_SPREADSHEET_ID',
    sheet = SpreadsheetApp.openById(ssID).getSheets()[0],
    data = sheet.getDataRange().getValues();

  return data;
}
Next create an html file inside the script editor and save it as index.html
<!DOCTYPE html>
<html>
  <head>
    <script src="https://www.google.com/jsapi"></script>
  </head>

  <body>
    <div id="main"></div>

    <script>
      google.load('visualization', '1', {
        packages: ['corechart', 'bar']
      });

      google.setOnLoadCallback(getSpreadsheetData);

      function getSpreadsheetData() {
        google.script.run.withSuccessHandler(drawChart).getSpreadsheetData();
      }

      function drawChart(rows) {
        var options = {
          title: 'Population (in Millions)',
          legend: 'none',
          chartArea: {
            width: '60%'
          },
          vAxis: {
            textStyle: {
              fontFamily: 'Arial',
              fontSize: 12
            }
          }
        };

        var data = google.visualization.arrayToDataTable(rows, false),
          chart = new google.visualization.BarChart(document.getElementById('main'));

        chart.draw(data, options);
      }
    </script>
  </body>
</html>
The above example fetches the rows of a single sheet but if your dashboard is complex and requires you to fetch data from multiple sheets in a spreadsheet, you can use the JSON form.
On the server side, create a JSON of your data and pass that to the HTML template after converting the JSON into a string (using JSON.stringify). On the client side, parse the string to convert it into JSON (using JSON.parse) and build your charts and graphs.